정보통신기술(ICT)
로보틱 플라스틱 분류 알고리즘
해머슴
2024. 11. 15. 12:41
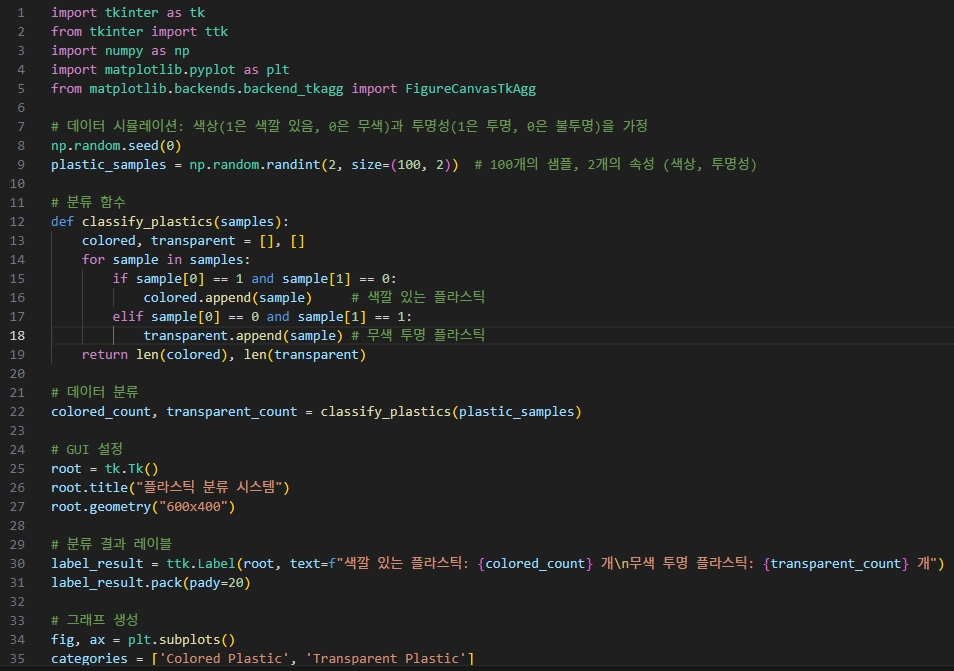
import tkinter as tk
from tkinter import ttk
import numpy as np
import matplotlib.pyplot as plt
from matplotlib.backends.backend_tkagg import FigureCanvasTkAgg
# 데이터 시뮬레이션: 색상(1은 색깔 있음, 0은 무색)과 투명성(1은 투명, 0은 불투명)을 가정
np.random.seed(0)
plastic_samples = np.random.randint(2, size=(100, 2)) # 100개의 샘플, 2개의 속성 (색상, 투명성)
# 분류 함수
def classify_plastics(samples):
colored, transparent = [], []
for sample in samples:
if sample[0] == 1 and sample[1] == 0:
colored.append(sample) # 색깔 있는 플라스틱
elif sample[0] == 0 and sample[1] == 1:
transparent.append(sample) # 무색 투명 플라스틱
return len(colored), len(transparent)
# 데이터 분류
colored_count, transparent_count = classify_plastics(plastic_samples)
# GUI 설정
root = tk.Tk()
root.title("플라스틱 분류 시스템")
root.geometry("600x400")
# 분류 결과 레이블
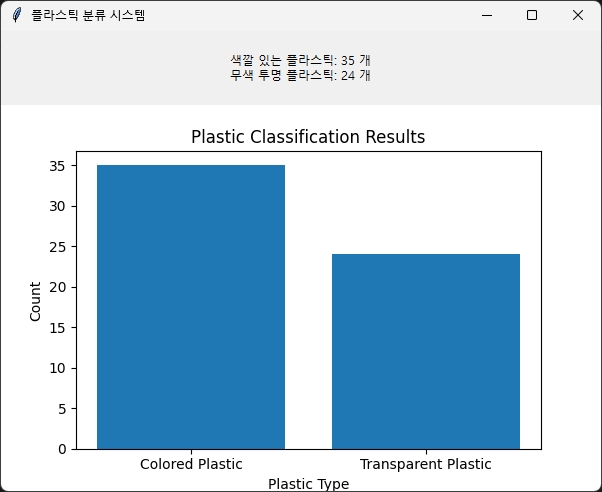
label_result = ttk.Label(root, text=f"색깔 있는 플라스틱: {colored_count} 개\n무색 투명 플라스틱: {transparent_count} 개")
label_result.pack(pady=20)
# 그래프 생성
fig, ax = plt.subplots()
categories = ['Colored Plastic', 'Transparent Plastic']
counts = [colored_count, transparent_count]
ax.bar(categories, counts)
ax.set_title('Plastic Classification Results')
ax.set_xlabel('Plastic Type')
ax.set_ylabel('Count')
# Matplotlib 그래프를 tkinter 캔버스로 표시
canvas = FigureCanvasTkAgg(fig, master=root)
canvas.draw()
canvas.get_tk_widget().pack()
# GUI 실행
root.mainloop()