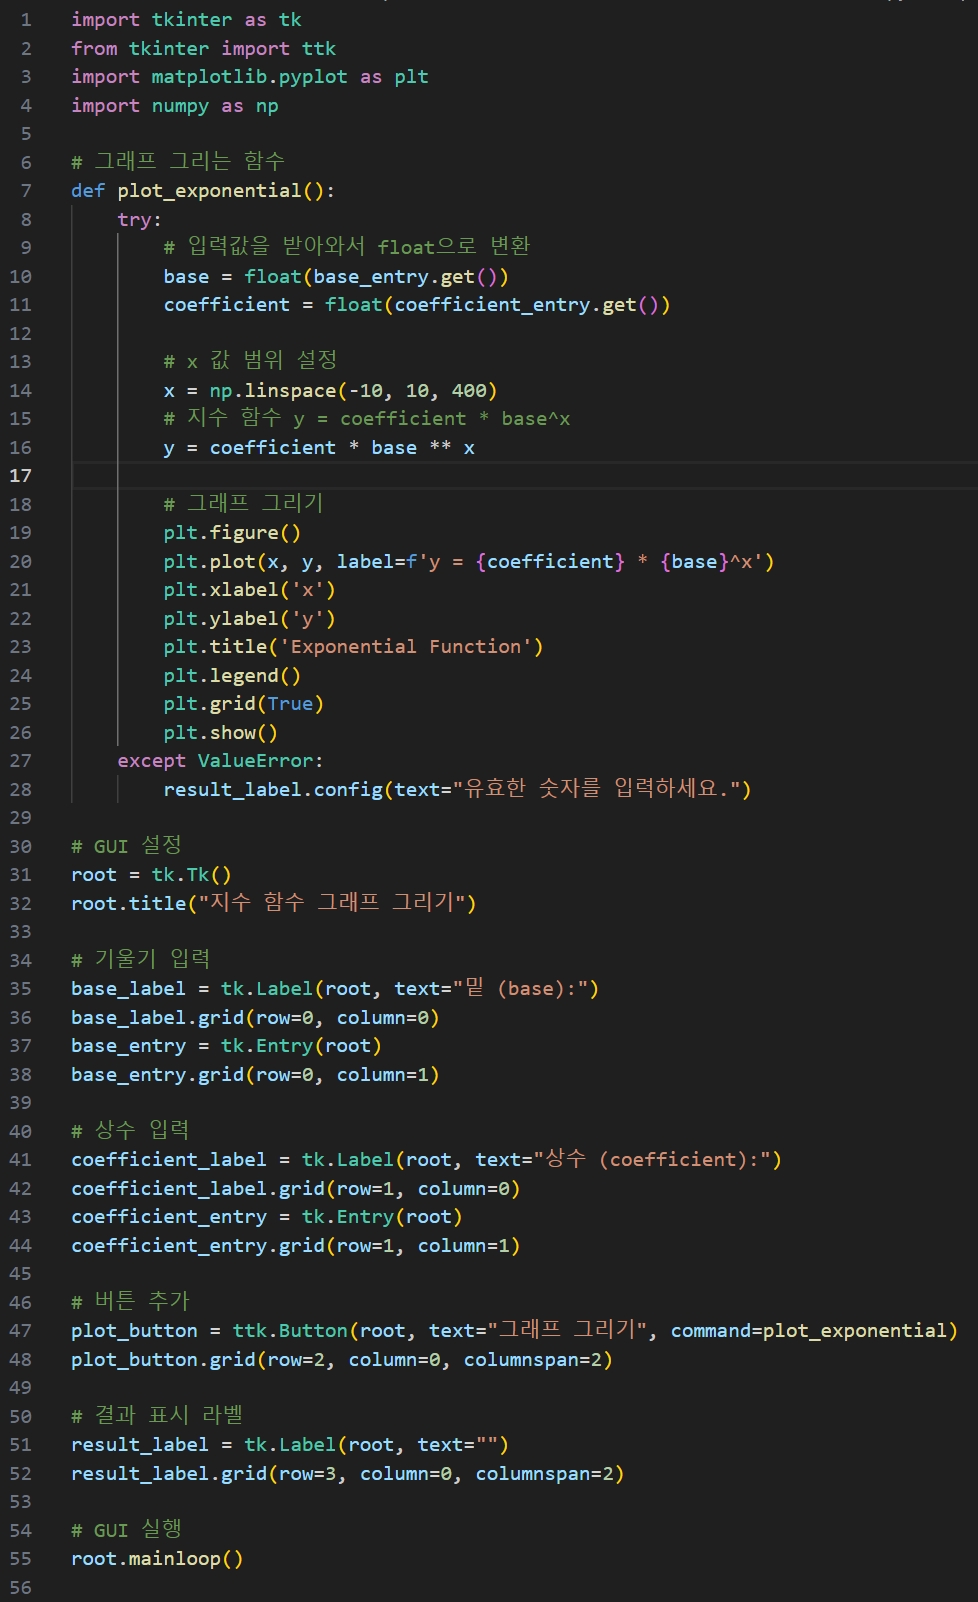
import tkinter as tk
from tkinter import ttk
import matplotlib.pyplot as plt
import numpy as np
# 그래프 그리는 함수
def plot_exponential():
try:
# 입력값을 받아와서 float으로 변환
base = float(base_entry.get())
coefficient = float(coefficient_entry.get())
# x 값 범위 설정
x = np.linspace(-10, 10, 400)
# 지수 함수 y = coefficient * base^x
y = coefficient * base ** x
# 그래프 그리기
plt.figure()
plt.plot(x, y, label=f'y = {coefficient} * {base}^x')
plt.xlabel('x')
plt.ylabel('y')
plt.title('Exponential Function')
plt.legend()
plt.grid(True)
plt.show()
except ValueError:
result_label.config(text="유효한 숫자를 입력하세요.")
# GUI 설정
root = tk.Tk()
root.title("지수 함수 그래프 그리기")
# 기울기 입력
base_label = tk.Label(root, text="밑 (base):")
base_label.grid(row=0, column=0)
base_entry = tk.Entry(root)
base_entry.grid(row=0, column=1)
# 상수 입력
coefficient_label = tk.Label(root, text="상수 (coefficient):")
coefficient_label.grid(row=1, column=0)
coefficient_entry = tk.Entry(root)
coefficient_entry.grid(row=1, column=1)
# 버튼 추가
plot_button = ttk.Button(root, text="그래프 그리기", command=plot_exponential)
plot_button.grid(row=2, column=0, columnspan=2)
# 결과 표시 라벨
result_label = tk.Label(root, text="")
result_label.grid(row=3, column=0, columnspan=2)
# GUI 실행
root.mainloop()
'정보통신기술(ICT)' 카테고리의 다른 글
| 양자역학 1차원 조화진동자의 파동함수(Hermite Polynomial) (0) | 2024.10.17 |
|---|---|
| 최대값과 최소값 함수 (0) | 2024.10.15 |
| 절대값 함수 (0) | 2024.10.11 |
| 역삼각 함수 (0) | 2024.10.10 |
| 쌍곡 함수 (1) | 2024.10.08 |